
Version 0.2
© 2015 James Chandler Jr
email: errnum@gmail.com
Should run on most versions of MS Windows. This program calculates basic frequency response statistics based on Room EQ Wizard measurements, exported from REW as TXT files.
This is free third-party software. No warranty. All liabilities disclaimed. Not affiliated with Room EQ Wizard software or its author. The program merely calculates statistics extracted from exported REW measurement txt files.
Click here (or right-click | download) for free download of FRStatsCalc 0.2
After download, unzip and run the installer.
First, you need a measurement txt file from Room EQ Wizard. Run REW and make or load a measurement, then use the REW menu item File|Export|Measurement as text.
Frequency Response Stats Calculator expects measurement data items separated by space characters, so make sure that option is set via the REW menu item File|Export|Set text delimiter (Space).
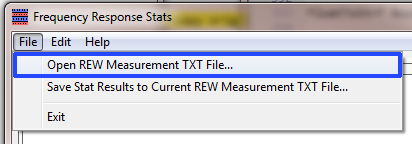
Now run FR Stats Calc and open the REW measurement txt file--
Assuming no error, the main window should look something like this--
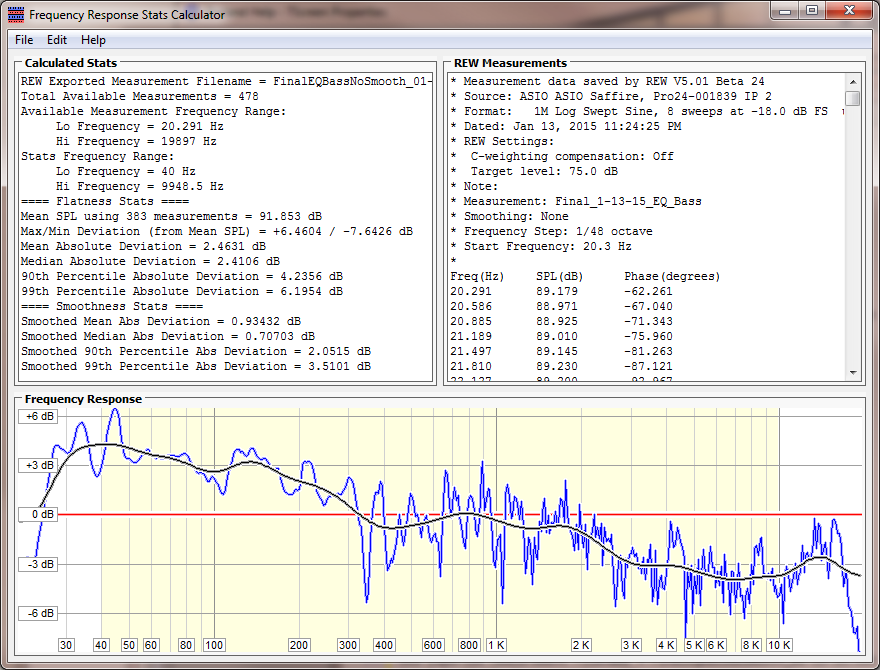
By default, statistics are calculated within a range of 40 Hz to 10 Khz. The defaults are based on an assumption that measurements below 40 Hz or above 10 Khz may be more difficult to flatten in many rooms. Therefore the default analysis frequency range ignores very high and very low frequencies which may “unfairly” skew achievable results in the mid-band where room treatment is most feasible.
You can change the stats frequency range by right-clicking a desired frequency line in the REW Measurements box, after which the stats are automatically recalculated based on the new frequency limits--

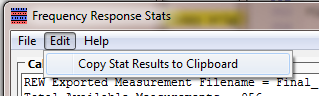
There are two ways to save the results (the data displayed in the Calculated Stats box)--
You can copy the data to the clipboard, then paste the text into a text editor-- A word processor, internet forum message, or whatever.
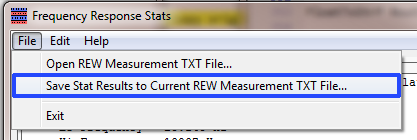
Alternately, you can save a txt file which prepends the stats data lines to the REW measurement text. You can either save to a new filename, or the original measurement txt file name. Note-- In some cases, file permissions problems could possibly prevent saving to the original filename, replacing the original file. In which case, select a different filename or file location for the saved .txt file.
The primary purpose of the Frequency Response graphic is to clearly illustrate the basis of the Stats.
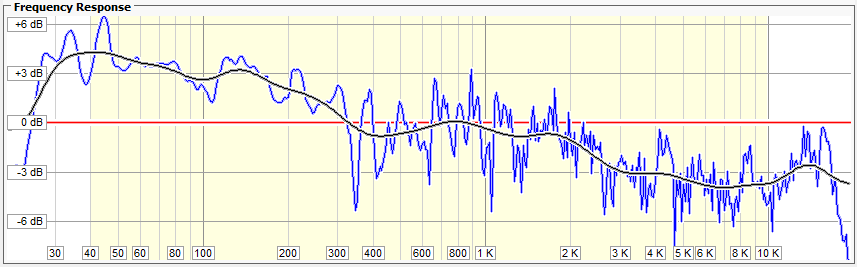
The yellow hilited area shows the Stats Frequency range, which can be modified by right-clicking in the REW Measurements box.
The Mean SPL of the Frequency Response is drawn in red (as calculated within the bounds of the yellow hilited area).
The REW frequency plot is drawn in blue.
The Smoothed Frequency Response is plotted in black-- A gaussian smoothing with a width of two octaves.
Resize the window to see a bigger (or smaller) Frequency Response graphic.
The chart is always auto-sized to fit the frequency response SPL range. Therefore, more-flat responses are automatically magnified to fill the box. Less-flat responses are automatically zoomed-out to fill the box.This is intended to be analytical rather than aesthetic or reassuring.
No matter how good the frequency response, the plot will probably look rather jaggy, because the flatter you get the response, the more-magnified will be whatever defects remain. A visual hint would be the left-hand dB markings. A flat plot will display as low as 1 dB per division, but rough plots could display 10 or more dB per division-- Whatever amount of zoom is necessary to fit the plot into the available chart space.
Horizontal dB lines are always referenced with a Mean SPL of 0 dB, regardless the absolute SPL levels in the exported REW measurement file.
Flatness stats are calculated based on the blue frequency response line versus the red Mean SPL line.
Smoothness stats are calculated based on the blue frequency response line versus the black Smoothed Frequency Response line.
REW Exported Measurement Filename: The filename of the REW exported measurement txt file.
Total Available Measurements: The total number of measurement data lines found in the REW exported measurement txt file. The number of data lines will depend on the smoothing which was selected when you exported the measurement file. Also, the stats results will depend on the selected smoothing. For instance, octave smoothing will show “more optimistic” stats than 24th octave smoothing, and 24th octave smoothing will show “more optimistic” stats than No Smoothing.
Note: FRStatsCalc is programmed to skip over any header comment lines beginning with an (*) asterisk character. It expects to find data following a block of asterisk comment lines. If a measurement txt file has been edited to contain any “non-asterisk” lines before the beginning of numeric data lines, then FRStatsCalc will fail to properly parse the txt file.
Available Measurement Frequency Range: The lowest and highest frequencies found in the REW exported measurement txt file.
Stats Frequency Range: The frequency range used to calculate the stats. The default frequency range is 40 Hz to 10 Khz. You can right click on data lines in the REW Measurements box to change the frequency range, after which the stats are recalculated based on the new frequency range.
Flatness Stats: The Flatness stats are based on the mean spl of a measurement. Smaller numbers should indicate flatter frequency response. In addition, if two measurements are about equally flat, a smaller number should indicate a smoother flat frequency response-- A smoother frequency response would have smaller, less-bumpy deviations from “ruler-flat”.
Mean SPL using xxx measurements = yyy dB: The number of data lines within the stats frequency range, and the average dB level over the stats frequency range.
Max/Min Deviation (from Mean SPL) = +xxx / -yyy dB: The maximum positive and negative deviations from the Mean SPL. For instance, given a measurement of +4 / -3 dB and a mean SPL of 80 dB, the largest measurement within the stats frequency range would be 84 dB, and the smallest measurement in the stats frequency range would be 77 dB.
Absolute Deviation definition: An absolute deviation is the unsigned difference between each measurement value versus the Mean SPL. For instance, if the mean SPL happens to be 80 dB, then measurement values of either 77 dB or 83 dB would have an absolute deviation of 3 dB.
Mean Absolute Deviation: The average of all the absolute deviations within the stats frequency range. For instance, given a Mean Absolute Deviation of 3 dB, it means that some deviations might be much larger than 3 dB and other deviations might be much smaller than 3 dB, but the average deviation is +/- 3 dB away from the mean SPL.
An “ideal” ruler-flat frequency response would have a Mean Absolute Deviation of zero. When comparing multiple REW measurements-- Measurements with smaller Mean Absolute Deviation should indicate a “more flat” frequency response. Measurements with larger Mean Absolute Deviation should indicate a “less flat” frequency response-- With zero being the “flattest it can get”.
Median Absolute Deviation: The median is the absolute deviation value which happens to be “exactly in the middle of the pack”. For instance, if the Median Absolute Deviation happens to be 3 dB, then you know that half of the measurements deviate less than 3 dB, and the other half of the measurements deviate greater than 3 dB. Median is the 50th percentile value.
In conjunction with Mean Absolute Deviation, Median is an alternate way to evaluate the “basic flatness”. For instance, if most deviations in a measurement happen to be small, but there are a few huge deviations-- The Mean might look overly discouraging because a small number of huge values have skewed the average. In that case, the median might give a better idea of what's going on.
For instance, given a sample of 100 people in a neighborhood-- If 99 people each have net worth of $10,000, but one fortunate fella has a net worth of $100,000,000-- The neighborhood's mean net worth is over a million dollars per person, but the median net worth is $10,000. In heavily skewed samples, the median might be more useful than the mean.
90th Percentile Absolute Deviation: The deviation value which is higher than 90 percent of all the measurements. For instance, if the 90th Percentile Deviation is 3 dB, then it means that 90 percent of the absolute deviations are less than 3 dB.
99th Percentile Absolute Deviation: The deviation value which is higher than 99 percent of all the measurements. For instance, if the 99th Percentile Deviation is 3 dB, then it means that 99 percent of the absolute deviations are less than 3 dB.
Smoothness Stats: The Smoothness stats are for comparing the smoothness of non-flat measurements. Some non-flat frequency responses are quite smooth, but other non-flat frequency responses are very bumpy.
A smooth but not-flat frequency response would not give very good numbers on the above Flatness Stats. For instance, on the Flatness Stats, a very smooth non-flat response might have worse numbers than a very bumpy flat response.
The Smoothness Stats are also valid for flat frequency responses. However, if you are trying to treat a room “as flat and smooth as possible”, then the Flatness Stats are possibly more appropriate.
If you don't care about the flatness of a frequency response, or if the target room curve is not flat, then the Smoothness Stats will be most useful for comparative purposes.
Smoothed Mean Abs Deviation: The average of all deviations from the Smoothed Frequency Response. For instance, given a Smoothed Mean Abs Deviation of 3 dB, some deviations might be much larger than 3 dB and other deviations might be much smaller than 3 dB, but the average deviation is +/- 3 dB away from the Smoothed Frequency Response.
A very smooth frequency response should have a very small Smoothed Mean Abs Deviation. When comparing multiple REW measurements-- Measurements with smaller Smoothed Mean Abs Deviation should indicate a “more smooth” frequency response. Measurements with larger Smoothed Mean Abs Deviation should indicate a “less smooth” frequency response.
Smoothed Median Abs Deviation: Similar to the above-described Median Absolute Deviation, except the deviations are calculated against the Smoothed Frequency Response rather than the Mean SPL.
Smoothed 90th Percentile Abs Deviation: Similar to the above-described 90th Percentile Absolute Deviation, except the deviations are calculated against the Smoothed Frequency Response rather than the Mean SPL.
Smoothed 99th Percentile Abs Deviation: Similar to the above-described 99th Percentile Absolute Deviation, except the deviations are calculated against the Smoothed Frequency Response rather than the Mean SPL.
Speakers or rooms are commonly specified in this general style: +2 / -3 dB, 60 Hz - 16 Khz (or whatever)
Unfortunately this doesn't tell us much. One speaker or room might be quite flat and smooth within the reported constraints, wheras some other speaker or room might have a very rough frequency response within the same constraints.
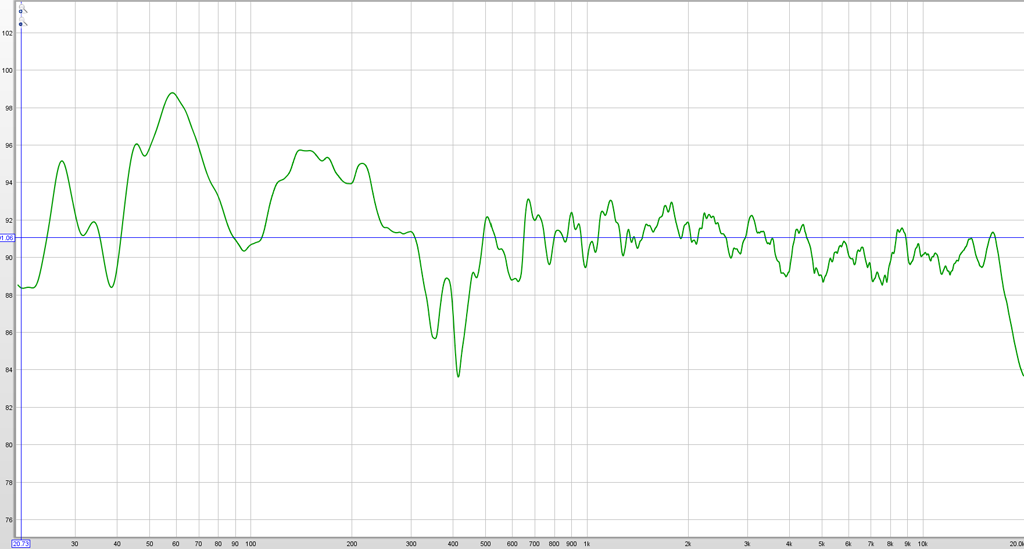
Below are two room frequency response plots which both measure +7.8 / -7.4 dB, but the second plot looks better above 500 Hz--
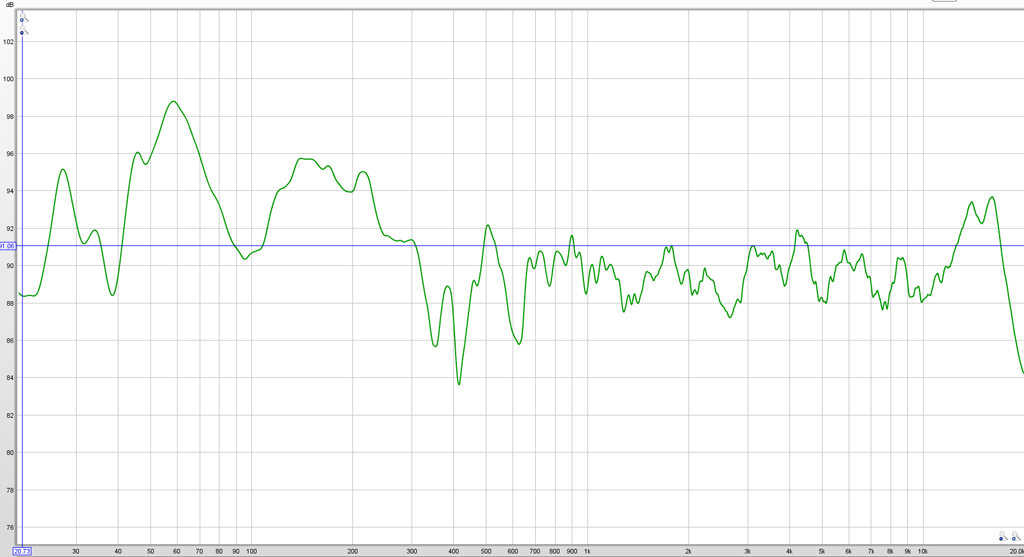
The second measurement is smoother above 500 Hz, yielding a smaller Mean Absolute Deviation and a smaller Median Absolute Deviation--
In this case it is fairly easy for the eye to notice an improvement on the second measurement, though it is nice to have numeric confirmation. However, over months of gradual treatment of my room and tweaking of speakers, crossovers and EQ-- It was not uncommon to make treatment changes or tweaks might would show “improvement” on some features while also showing apparent “regression” of other frequency response features. Causing head-scratching evaluative puzzles such as, “Is improvement at 1 Khz worth a regression at 200 Hz?”
A fella with excellent ears, or given many hours to audition/compare each variant, might eventually let his ears break the tie. However, ears are easy to fool, and as long as a sound isn't horribly terrible, the ear tends to accomodate about any sound even if significantly flawed. Sometimes cold statistics might help inform treatment and tweaking decisions.
The placebo effect-- If a person is emotionally involved, the ear might hear what the emotions want it to hear. The eye might see what the emotions want it to see. Additionally, it can sometimes be difficult for the eye to judge whether squiggle A is better or worse than squiggle B; difficult for the ear to judge whether sound A is better or worse than sound B.
Having spent time and money on treatment or tweaking, we might become emotionally invested in seeing/hearing improvement, regardless whether treatment or tweaking made any objective positive impact. An objective figure of merit such as Mean or Median Absolute Deviation might function as reality check on whether we are fooling ourselves.
Over many months of tweaking my room, I saved measurements after every tweak, using the excellent Room EQ Wizard. It is gratifying to review the steady improvement of the measurement stats over time-- Objective confirmation that the work earned positive results. The frequency response plots also show progressive improvement though it is sometimes difficult to judge “how much” Plot B looks better than Plot A. Sometimes, impossible to judge by eye alone.
Of course along the way I made failed treatment experiments requiring removal or modification. Numeric confirmation of failed experiments was equally useful.
For historic comparison of measurments, it is beneficial to always export the measurement txt files using the same smoothing amount. I have mostly used 24th octave smoothing, but any smoothing amount would allow valid historical comparison, provided that all comparative measurements use the same smoothing value. Of course comparative measurements should also be made under as close as possible identical conditions-- Using the same audio interface, microphone and preamp; using the same microphone location, etc.
The stats, except for Mean SPL, should be insensitive to level variation between measurements. For instance, if one measurement has a Mean Absolute Deviation of 2 dB at a Mean SPL of 80 dB, then it should yield that same Mean Absolute Deviation value of 2 dB at any other Mean SPL Level-- As long as the REW frequency response curve stays identical, then the Mean SPL shouldn't affect the other stats.
I suspect that the most unbiased comparisons might best be based on un-smoothed exported REW measurements, especially if trying to compare non-flat frequency responses via the Smoothness Stats.