
Disclaimer-- The following could contain errors and no expertise is claimed.
Data is presented in reverse-order-- The most recent tweaked results followed by tedious trivia perhaps most useful as treatment for insomnia.
Tweaking / Evaluation Strategy
Whether right or wrong, my strategy was to first treat the small office acoustics as good as feasible-- And then tweak the sound system as good as feasible. Perhaps I can learn how to further improve the office acoustics but at present the office is what it is-- Better than some rooms and worse than others. Except for improved office acoustics, the last chance for improvement are sound system tweaks.
In my opinion even a caviar deluxe sound system would benefit from tweaking. A speaker needs to play flat and clean in my imperfect room, not an anechoic chamber. Uneven frequency response in the un-equalized speaker might not be a deal-breaker provided that the speaker does not completely suck-- Though equalization can neither fix bad speakers nor turn sows ears into silk purses. At minimum a speaker+amp should be powerful enough to cleanly tolerate equalization.
EQ has limits-- For example, big powerful PA mid-frequency horns do not usually play super-tweeter frequencies. Aggressive EQ can't turn a mid horn into a clean super-tweeter. Neither can aggressive EQ turn a mid horn into a clean subwoofer. Not only is it impossible to squeeze blood out of turnips-- There ain't no such thang as a free turnip! EQ is similarly incapable of “fixing” some kinds of room acoustical problems.
Therefore, given a mix of speaker limitations plus room limitations-- Take the lemons and make lemonade which tastes as good as possible.
These measurements combine speaker imperfections with acoustic and tweaking imperfections. At best the data might enable slightly-less-wild guesses on the nature of the speakers. The same speakers would have different measurements in other rooms.
3rd Octave Smoothing
Explained in this Genelec Survey of Monitoring Conditions-- “In-situ frequency response measured at the engineer's position using third-octave smoothing should be flat within ± 3dB from 50Hz to 16kHz with some level reduction allowed at high frequencies [AES, EBU].”
That might be a fairly easy hurdle, assuming we have speakers which do not completely suck in a treated room which does not completely suck. The following plot compares the old JBL 4208 monitors + subwoofers against the new homemade cheap coax speakers + subwoofer. The JBL measurement was made awhile ago but the room treatment and speaker locations are identical for both tests. Nothing changed except the speakers, amps, and electronic adjustments. Both old and new were equalized as flat as I could do it. The new frequency response looks better but maybe I was luckier when setting the EQ. Or maybe the coax speakers really are “a little better in some respects” which made them easier to EQ. I do not know.
At no bigger than +/-1 dB, both the old and new systems seem to pass a +/-3 dB at 3rd Oct smoothing test, though that Genelec paper lists other requirements which may be less-easy to pass.
Obsessed With Flat?
I do not use the system flat. Right or wrong, my first step toward a listening curve is to flatten the system. I want the response as flat possible for referencing music timbre and balance and do not want to stray far from flat just to make the speakers sound “pretty”. But speakers also need to sound good or at least not obnoxious. In practice I add a few dB of bass. My ear wants to hear more bass than flat systems deliver, except at ear-damaging loud sound levels.
Many people roll off highs on listening curves. After much testing of the old system (before the coax speakers)-- My ear was not always happy with high-frequency rolloff. A couple of dB HF rolloff sounded fine on very bright records but there were too many “mellow” records which were not bright enough with HF rolloff. Maybe I will eventually roll off the coax HF but so far have been auditioning “as flat as possible” except for slightly boosted bass.
Which explains the obsession on FLAT. I won't listen flat but figure if a system can do flat-- The response can then be modified “just the right amount” for a compromise between accuracy vs pleasing sound. FLAT also seems easiest to compare/evaluate.
Unsmooth
The same measurements sans smoothing deliver a ruder reality check--
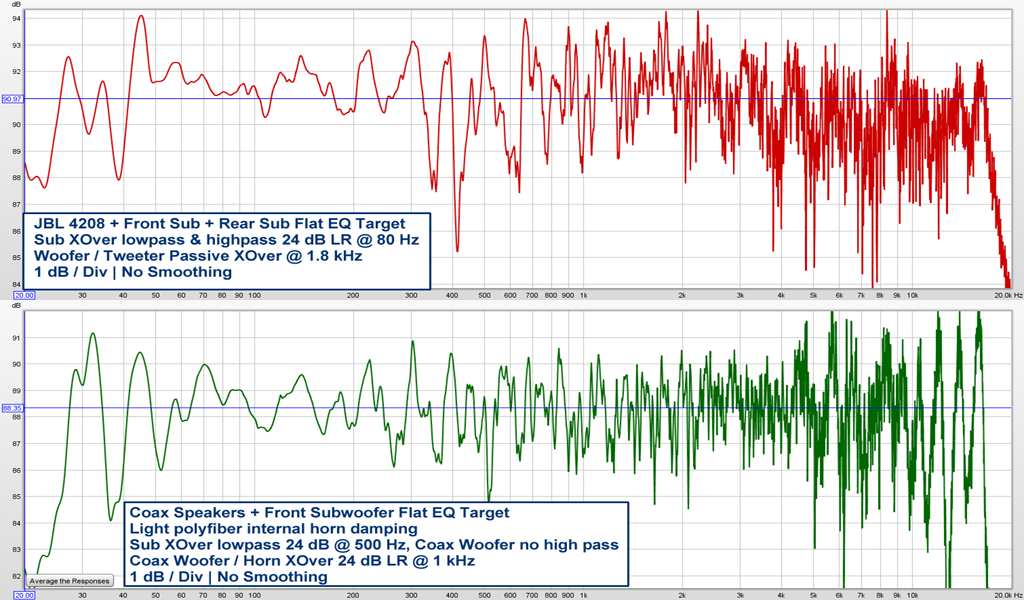
Speakers and rooms typically have numerous unsmoothed narrow peaks and dips. Somehow the ear and brain makes sense of it. These plots only show about 10 dB unsmoothed peaks/dips. Dunno if that is good or bad.
Though perhaps mere plot artifacts-- Above 3 kHz the JBL's tiny titanium tweeter visually differs from the coax horn's bigger-diameter polyimide diaphragm.
The coax horn shows “lumpy” response above 5 kHz-- A regular repeated washboard pattern of slightly loud then slightly quiet. However the fine-grained unsmoothed peaks/dips superimposed on that washboard pattern do not look very big.
The tiny JBL titanium tweeter does not show as big washboard high frequency pattern but the fine-grained unsmoothed peaks/dips look bigger than the polyimide horn driver. Is it better to have smaller unsmoothed peaks/dips superimposed on a bigger washboard pattern? Or is it better to have bigger unsmoothed peaks/dips superimposed on a smaller washboard pattern?
NOTE: The coax horn HF washboard pattern does not seem a measurement artifact. For both speakers testing, the measurement mic is always precisely located between speakers. Individual left-only and Right-only tests show near-identical HF peak/dip frequencies.
Furthermore, room acoustics seem an unlikely factor. If room acoustics cause the HF washboard then one might expect the JBL speakers to share the same pattern-- The JBL speakers were tested in the same room with the same treatments at the same speaker locations.
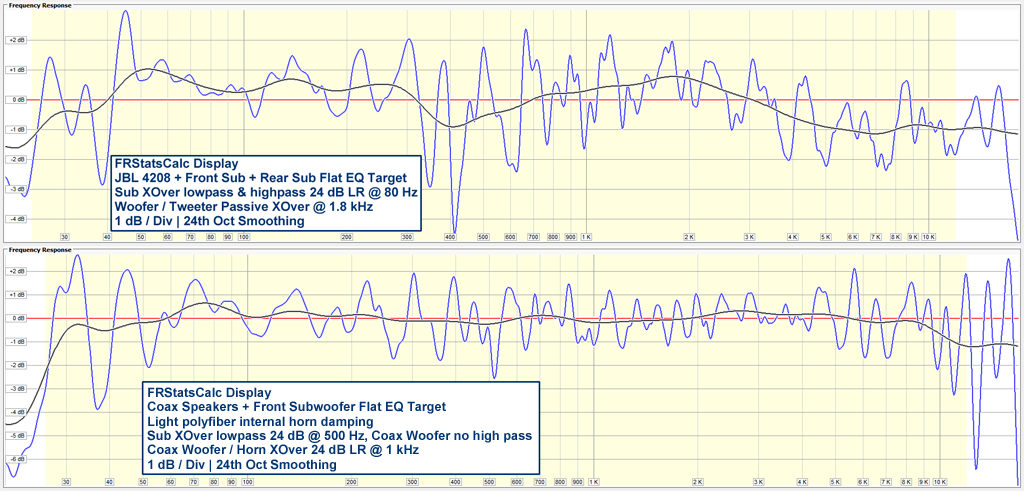
24th Octave Smoothing
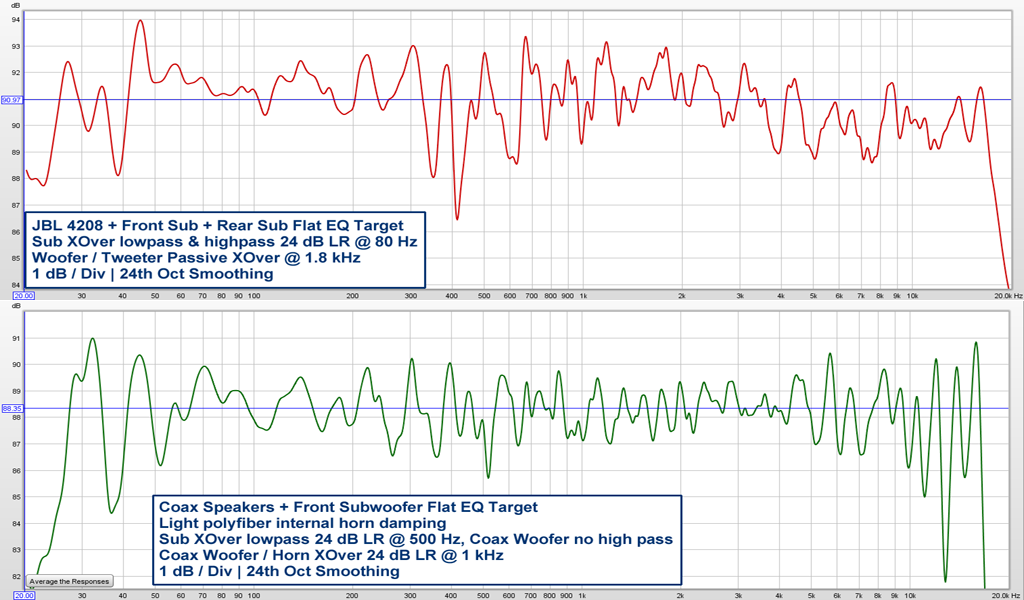
For lack of a better description, the coax speakers appear smoother than the JBL plots. The JBL peak/dip pattern looks more jagged/irregular/kinky. Room acoustics cause many if not most irregularities. On the other hand we compare the same speaker locations in the same room with the same guy doing his best to equalize the response. Overall the coax speakers MIGHT be driving the room slightly smoother, though I don't know if the difference might be audible.
Tweak Technique
I used mostly 24th Octave smoothing for tweaking DriveRack crossover, levels, parametric and graphic EQ. The DriveRack has fairly effective Auto-EQ but manual tweaks based on REW sweeps can outperform DriveRack Auto-EQ. REW can't automatically EQ the DriveRack because this model of DriveRack does not have MIDI or other remote control. I briefly experimented with REW auto-EQ-- Let REW calculate the filters and then manually push buttons on the DriveRack to enter REW suggested settings. Maybe that would work good though REW doesn't know the exact characteristics of DriveRack filters. Am just so accustomed to manual EQ tweaking that it is no hassle doing it “the hard way” or whatever.
After performing most of the EQ at 24th Octave resolution I fine-tune via lower-resolution plots which show more forest and fewer trees. Room EQ Wizard documentation suggests VAR smoothing for equalization. VAR applies no smoothing in the bass, gradually widening to 3rd octave smoothing at high frequencies.
Psychoacoustic Smoothing
REW recently added Psychoacoustic smoothing-- “Psychoacoustic smoothing uses 1/3 octave below 100Hz, 1/6 octave above 1 kHz and varies from 1/3 octave to 1/6 octave between 100 Hz and 1 kHz. It also applies more weighting to peaks by using a cubic mean (cube root of the average of the cubed values) to produce a plot that more closely corresponds to the perceived frequency response.”
Horns can have “peaky sound” so I tried Psychoacoustic smoothing for final polishing. If Psy smoothing gives more weight to peaks then possibly it could achieve smoother horn sound.
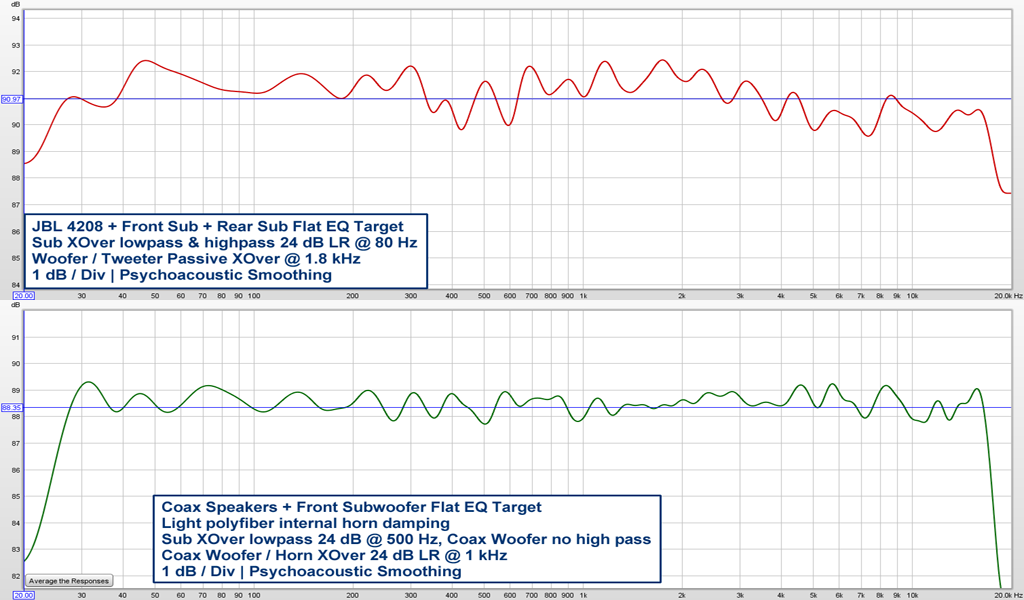
REW did not have a Psy smoothing option when the JBLs were tweaked and measured. If the JBLs had been tweaked according to Psy smoothing then maybe they would look flatter according to that scale. I avoided extreme EQ on the JBLs-- Which may partially explain the less-flat JBL plot. Perhaps I was reluctant to EQ heavily enough to achieve a more-perfect flattening.
On the other hand, several frequency bands were difficult to fix with the JBLs. Nulls around 400 Hz were difficult to solve. I can't recall specifics but a few high frequencies may have been problematic. JBL usually publishes accurate frequency plots. The JBL 4208 generic anechoic plot shows +/-2 dB from about 60 Hz up to above 10 kHz. Therefore any difficulties flattening the JBL in my room were perhaps more the room's fault rather than the speaker's fault.
The World of Null-B
The office acoustic treatment is good enough to control room modes except the lowest null at 37.5 Hz. The 37.5 Hz null stubbornly remains about 8 dB deep at the listening position. Before treatment, that 37.5 Hz null was near-total and the current -8 dB null is a hard-won improvement. Sad but true.
With the JBLs, the null was partially solved with a carefully tweaked additional rear corner subwoofer-- An imperfect fix with a few undesirable side-effects.
The same “two subwoofer” null-control method was tested with the coax speakers-- Yielding similar mixed results. However the currently-reported “best response so far” does not use a rear subwoofer. It uses a different front subwoofer crossover alignment plus a narrow 37.5 Hz parametric EQ boost.
With a revised crossover alignment, the coax speakers only require three graphic EQ adjustments at about 4 dB-- The majority of graphic EQ bands are within +/-1 dB of flat except above 5 kHz-- Highest EQ bands are boosted to compensate the coax horn high frequency rolloff.
Tis unknown how the JBLs would perform with the recently changed coax crossover alignment. When experimenting on the JBLs I tested MANY subwoofer crossover settings. Maybe I tested something similar but with poorer results-- Or maybe I was too dumb to try EXACTLY this current crossover alignment.
Coax low-midrange improvements are possibly due to changed woofer height. The 8 inch JBLs are a conventional 2-way cab design almost as tall as the 12 inch coax cabinets. The JBL woofer sat a few inches closer to the floor and farther from the ceiling. The speaker shelf was intentionally built to locate the JBL vertical acoustic center at ear-level. Ear-level for the coax cabinet locates its woofer a few inches higher than the previous JBL woofer vertical location. Possibly this change in woofer height could alter whatever low-midrange peaks/nulls were caused by floor/ceiling bounce.
FRSC Results
As interpreted by my free FRStatsCalc program which is intended to objectively evaluate frequency response quality-- FRSC features adjustable stats frequency range. Low frequency was set to each measurement's approx -3 dB cutoff. High Frequency was set to 12 kHz because that is the limit of my elderly ears. Am not concerned about the perfect reproduction of inaudible frequencies.
Some research implies that the ear is not very discriminating in the top couple of octaves. Even with younger ears which can hear higher, so long as overall HF level is close enough for rock'n'roll, possibly the fine treble peak/null details are not so important? High frequencies only constitute a tiny fraction of music power. The lion's share of music power occupies bass thru the upper mids.
Flatness Stats-- At 24th Oct smoothing, the coax + sub system is +2.7/-3.9 dB at 26 Hz to 12 kHz. The old JBL + sub system was +3/-4.5 at 24 Hz to 12 kHz. The coax + sub system shows slightly lower (better) mean, median and 90th percentile absolute deviations. The coax system's rarest 99th percentile deviations are bigger than the old JBL system. The coax system has a few “bigger” outliers.
Smoothness Stats-- The smoothness stats were intended to gauge the smoothness of intentionally non-flat sound systems. For instance if a listening curve has been intentionally designed with bass boost and treble rolloff-- Then the flatness stats would not give meaningful numbers. Surprisingly the old JBL system shows lower (better) smoothness stats! This might be more significant had the JBL system been intentionally equalized against a non-flat listening curve. On the other hand, because the JBL system was equalized against a flat target, then I don't know if it is significant that the JBL system shows smoother deviations of a non-flat response! On the other hand, perhaps the smoothness stats really do show something significant hidden in the data. Dunno.
Am fairly certain that the FRSC calculations are correct. My eye does not see how FRSC manages to calculate better JBL smoothness. If the calculations really are correct then perhaps this demonstrates that “cold hard statistics” can be better than eyeball frequency response evaluation?
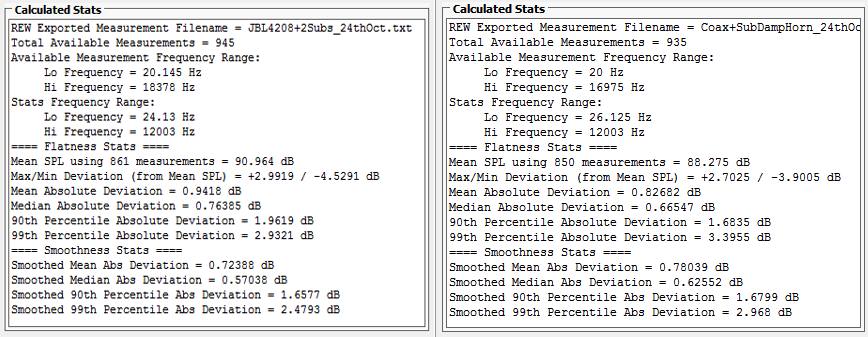
FRStatsCalc always fills the available plot vertical resolution. Lumpy measurements with wide variations are automatically “zoomed out” to fit the available window space. Flatter measurements with narrow variations are automatically “zoomed in” to fit the available window space.
The analysis frequency range is hilited in yellow. The red line indicates average SPL over the analysis frequency range. Flatness stats are deviations from that red average SPL. The black line indicates heavily smoothed frequency response. Smoothness stats are deviations from that black smoothed line.
Impulse Response
It is commonly recommended that early reflections fall below -20 dB as quickly as possible and stay below -20 dB at least for the first 20 ms. Because the room was nearly the same for both speaker tests, then perhaps some of the impulse response differences are due to genuine speaker differences. The JBL speakers were “soft-soffit” surrounded by absorption. The coax speakers are larger and rounded, occupying much of volume previously filled by the soft-soffits. Additional very-nearfield absorbers shared identical configuration for both tests.
The JBL IR falls below -20 dB within 0.45 ms but the coax IR requires about 1.1 ms. The JBL IR decay may be slightly faster over the first 5 or 10 ms. It is hard to say for sure. Could these differences have something to do with the coax horns' “washboard” high frequency response pattern?

Total Harmonic Distortion
I have read that even excellent speakers commonly have more distortion than other components in an audio chain-- More distortion than microphones, mixers, processors or amplifiers. Tis difficult to find statistics about average real world speaker distortion levels. Perhaps the reader can research more and better information than I managed to find.
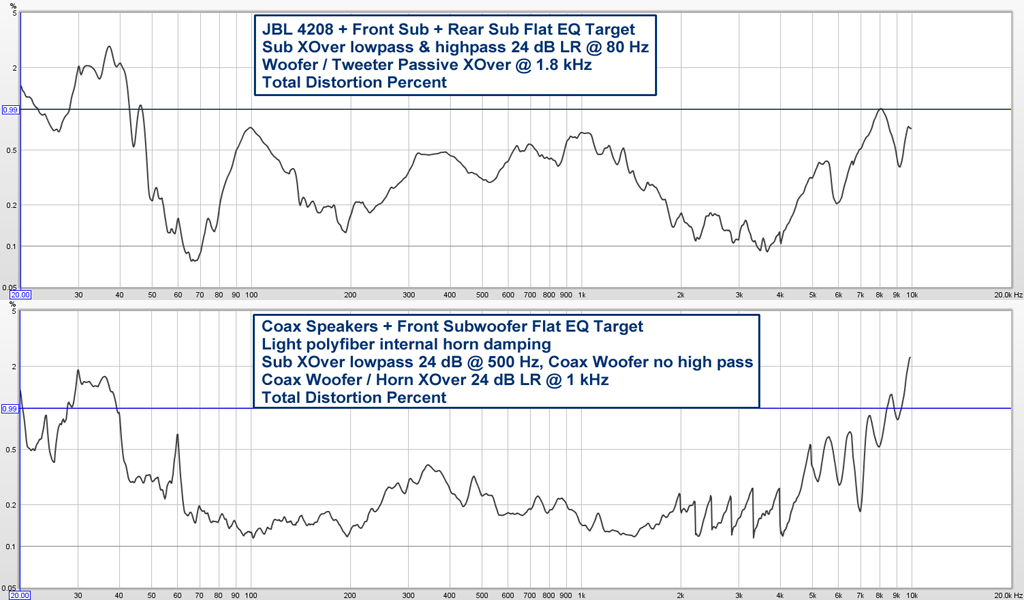
A Neuman Explanation suggests-- “Ideally the lower the harmonic distortion, the cleaner, or more transparent, the loudspeaker will sound. Less than -30 dB (3%) at low frequency and less than -40 dB (1%) at mid-high frequencies is normally considered to be good, lower values than these is of course better.”
The JBL measurement combines a “good” 18 inch front subwoofer along with a “not so good” ancient 100 watt 12 inch Mitsubishi rear subwoofer. The rear subwoofer was adjusted to reduce a 37.5 Hz modal null. The old Mitsubishi rear subwoofer shows significant second-harmonic octave-doubling distortion. The old rear subwoofer was probably a major contributor to the JBL system low-frequency distortion.
Because the JBL system used 80 Hz Linkwitz Riley 24 dB crossovers-- Perhaps it is safe to assume that the distortion peaks at 100 Hz, 350 Hz, 650 Hz and 1 kHz can be blamed on the JBL 8 inch woofer. The JBL titanium tweeter crossover is 1.8 kHz and distortion within the tweeter range is fairly low up to about 5 kHz. Distortion tended to be mostly 2nd harmonic below 200 Hz and above about 2 kHz. Distortion tended to be mostly 3rd harmonic between 200 Hz and 2 kHz. Distortion (according to the REW evaluation) appears <=1 percent above about 46 Hz.
The coax system measurement does not use the “bad” old rear subwoofer and shows less bass distortion, though it still reaches up to about 1.6 percent between 30 and 40 Hz. Coax system distortion tends to be mostly 2nd harmonic below 100 Hz and above about 4 kHz. Coax system distortion tends to be mostly 3rd harmonic between 200 Hz to 1 kHz. There appears to be about equal amounts of 2nd and 3rd harmonic distortion between 100 to 200 Hz, and also between 1 kHz to 4 kHz.
Coax system distortion appears generally lower than the JBL system distortion up to about 5 kHz. Above 5 kHz both systems have “comparable levels” of distortion though the curve details differ. Coax system distortion appears <= 1 percent above 40 Hz, until peaking slightly over 1 percent again around 8.5 kHz.
Rough eyeball estimation seems to show an average coax system distortion of perhaps 0.2 percent between about 60 Hz to 5 Khz. Equally rough eyeball estimation seems to show an average distortion of perhaps 0.3 percent over the same range for the JBL system. Because distortion is plotted on a log scale, the eyeball might be woefully wrong. Math performed on the distortion numbers might show other average values.
Because both the old and new systems appear to be mostly 2nd harmonic distortion in the high frequencies, one might wonder about the audibility of high frequency distortion. I can't hear above about 12 kHz. Any 2nd harmonic distortion higher than about 6 kHz might be inaudible. The second harmonic of 6 kHz would be 12 kHz. The second harmonic of 7 kHz would be 14 kHz and it is doubtful that I could hear 14 kHz unless the distortion somehow managed a nonlinear ring modulation effect, splattering those inaudibly high frequencies down low enough to hear.
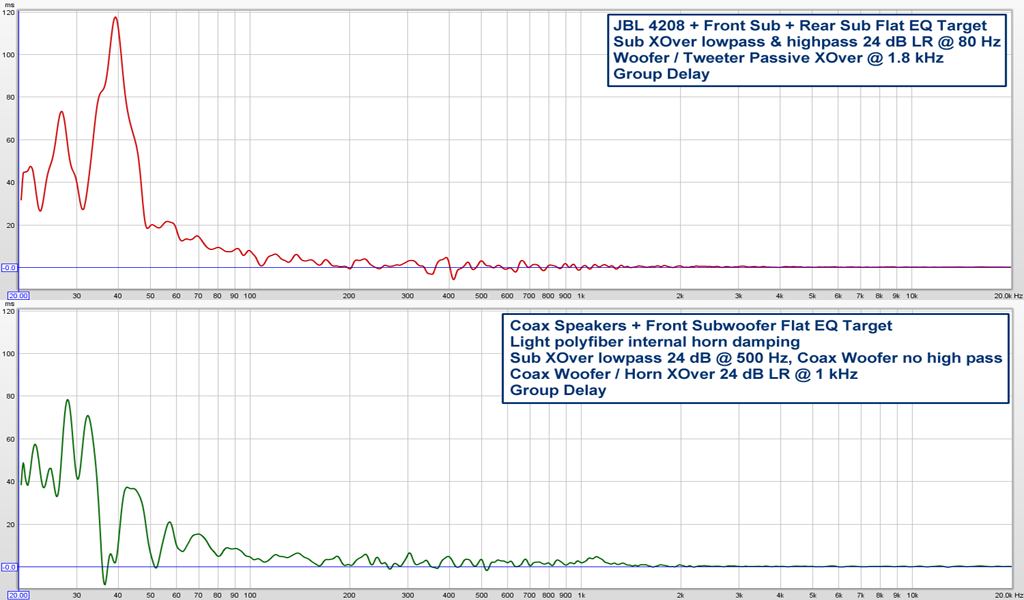
Group Delay
Given that room acoustics are likely responsible for the majority of group delay, perhaps it is unsurprising that both the old and new systems look so similar down to about 57 Hz. The coax system low bass group delay appears much improved. Most likely because the coax system does not use a rear subwoofer to minimize the room's 37.5 Hz modal null. The coax system attempts to minimize the null via changed crossover settings plus a modest 37.5 Hz narrow parametric boost. Which turns out to have fewer bad side effects than a second fill subwoofer-- In this specific instance anyway.
Waterfall
Both plots show 60 dB vertical display from the audio peak to the audio floor and both plots cover a 1000 ms z axis time span. Except for frequency response differences which we already discovered, both the old and new speaker systems appear to interact with the room in similar ways. The new coax system seems to show a somewhat longer bass decay than the old JBL system measurement, especially around 120 Hz. I believe that may have been REW picking up the sound of the house central air conditioner air handler which is on the same house floor.

Spectrogram
As with the group delay plot, those central dotted lines which represent “time of maximum sound energy” show coax system 37.5 Hz time response much-improved by turning off that rear subwoofer. The comparative color plots are interesting in that some frequency ranges look “smoother” in this kind of display for the old JBL system, whereas other frequency ranges look “smoother” on the coax spectrogram.

I had hoped that this third installment would finally wrap up a “boring but somewhat complete” report on the cheap coax speaker experiment. However I waxed mind-numbingly verbose and it appears that a fourth and final installment will be necessary to report on a few as-yet-unmentioned details and describe the subjective listening evaluation.
Back to Coaxial Speakers Build Part 2 - Speaker Selection
Back to Coaxial Speakers Build Part 1 - Construction